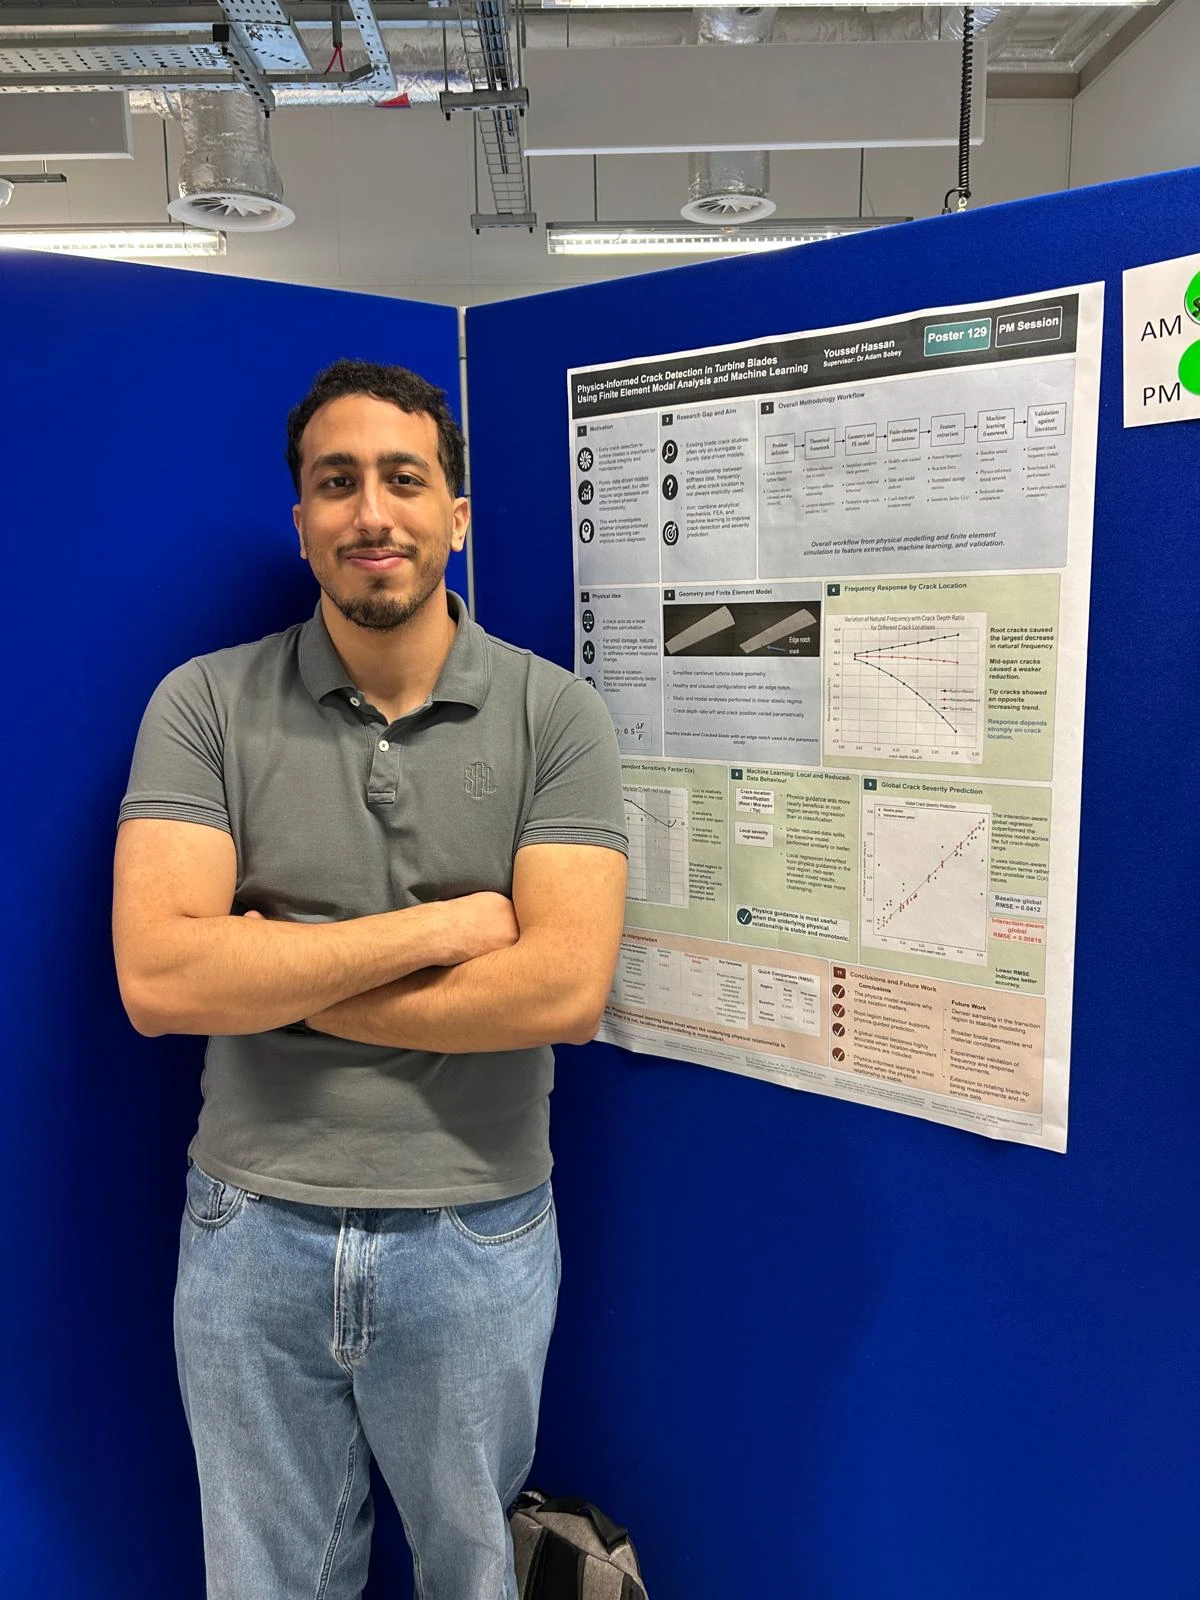
Could the response reveal the damage?
For my individual project, I wanted to see whether a blade’s response could tell us about a crack. I used simulation to study what changed, then looked at how that information could help a machine-learning model predict the damage.
With Dr Adam Sobey supervising, I built a parametric ANSYS workflow and used Python to organise the results and train small neural networks. What made it interesting was that an approach that worked near the root could perform badly further along the blade.
I started with a beam.
I started with a 200 × 20 × 10 mm cantilever beam. Under prescribed tip displacement, I compared reaction force, strain energy and the first bending frequency as the notch changed. This checked whether the reaction force could serve as a practical stiffness proxy.
I then moved to a tapered steel blade model, 138 mm high and 1.2 mm thick. The crack was represented by a rectangular edge notch. I varied its depth relative to the local blade width, so the severity target was the dimensionless ratio a/h.
Where the crack was mattered.
The main dataset contained 93 cracked cases: 31 depth ratios at each of three positions, 30, 80 and 130 mm from the root. Additional simulations explored the transition region.
Root cracks produced a strong frequency reduction. Mid-span changes were weaker, while tip cracks could increase the frequency even as the static reaction force reduced. So I couldn’t assume that the same response change meant the same amount of damage everywhere.
I examined a location-dependent sensitivity factor, C(x). Its unstable behaviour in the transition region helped explain why directly applying one physical rule across the blade could be unreliable.
The local results were mixed.
In the reported root-region comparison, RMSE fell from 0.0301 to 0.00661. At mid-span, the augmented model performed worse: RMSE increased from 0.0129 to 0.0384. I kept both results in the study.
Looking back at this comparison, there’s an important limit. The extra feature was half the force-change input already in the baseline model. It repeated information, so the difference in scores alone doesn’t prove that new physical knowledge helped. I keep that distinction in mind when discussing these results.
Then I added location to the model.
For the global model, I added crack position, normalised position and terms combining position with the response changes. The idea was to let the model account for where the crack was when predicting how severe it was.
I used a small feedforward network with 32 and 16 neurons in its hidden layers, a 75/25 random train/test split and early stopping. I fitted the input scalers on the training data before applying them to the test data. I used the mechanics to choose the inputs; I didn’t add a physics equation to the loss function.
Approximately 80% lower RMSE in the reported simulation-data comparison. Crack location was supplied as an input.
What I take from it.
What I took from this was that I needed to understand the simulation results before choosing the model inputs. Studying how the response changed along the blade gave me a reason to include location and the interaction terms.
These results come from a random split of my simulation dataset, with crack location given to the severity model. I haven’t shown that it works on new locations or real blades, or that it can find location and severity together. The plots and scores here are the ones reported in my dissertation.